Uncertainty
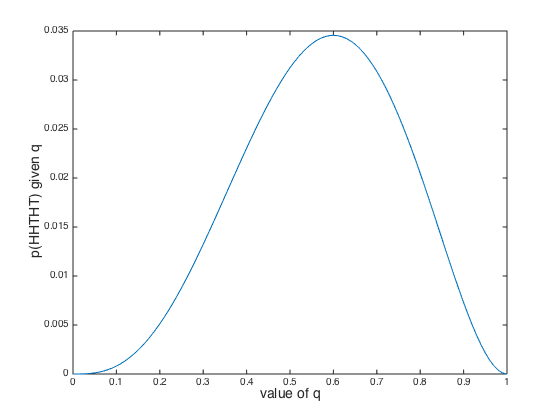
Let's consider again the likelihood function for q given the observations HHTHT.
?
The maximum likelihood estimate of q (the value of q for which the likelihood function
is maximized) is 0.6.
We could have arrived at this value simply by working out the proportion of heads in the
observed coin tosses. What is the added value of calculating the whole likelihood function?
Well, if we represent our beliefs about q as a distribution, we can say not only what
the most likely value of q is, but how likely or unlikely other values are.
- From the likelihood function plotted above, how confident are you that this is not a fair coin?
?
The value of q corresponding to a fair coin is 0.5.
This doesn't seem too unlikely given the likelihood function.
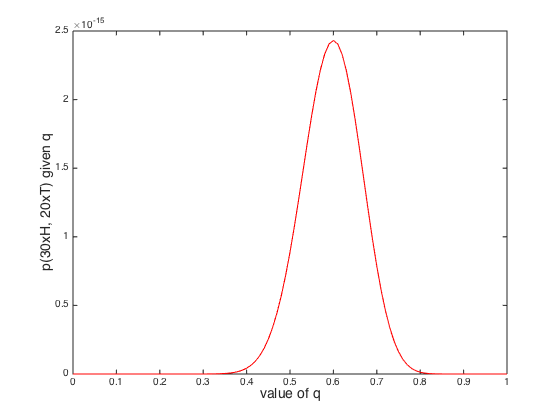
Let's consider another coin-tossing incident, in which I toss our coin 50 times, and observe
30 heads and 20 tails (i.e., the same ratio of heads and tails as our original experiment).
-
Use the code in Matlab script UncertaintyTutorial1.m, section 2, to plot the likelihood function.
-
Hopefully you should get something like this:
?
-
Compare the likelihood function for 50 coin tosses, 30 heads to the one we had earlier for 5 coin tosses, 3 heads.
-
What is the maximum likelihood value for q in each case?
?
0.6 in both cases
-
So did we learn something from the extra 45 coin tosses in the second case?
?
HINT: how likely is it that the coin was fair, given the likelihood function after 50 coin tosses?
?
Much less likely than after 5 coin tosses with the same ratio of heads to tails.
In the 50 coin toss example, there is much less uncertainty about the value of
q
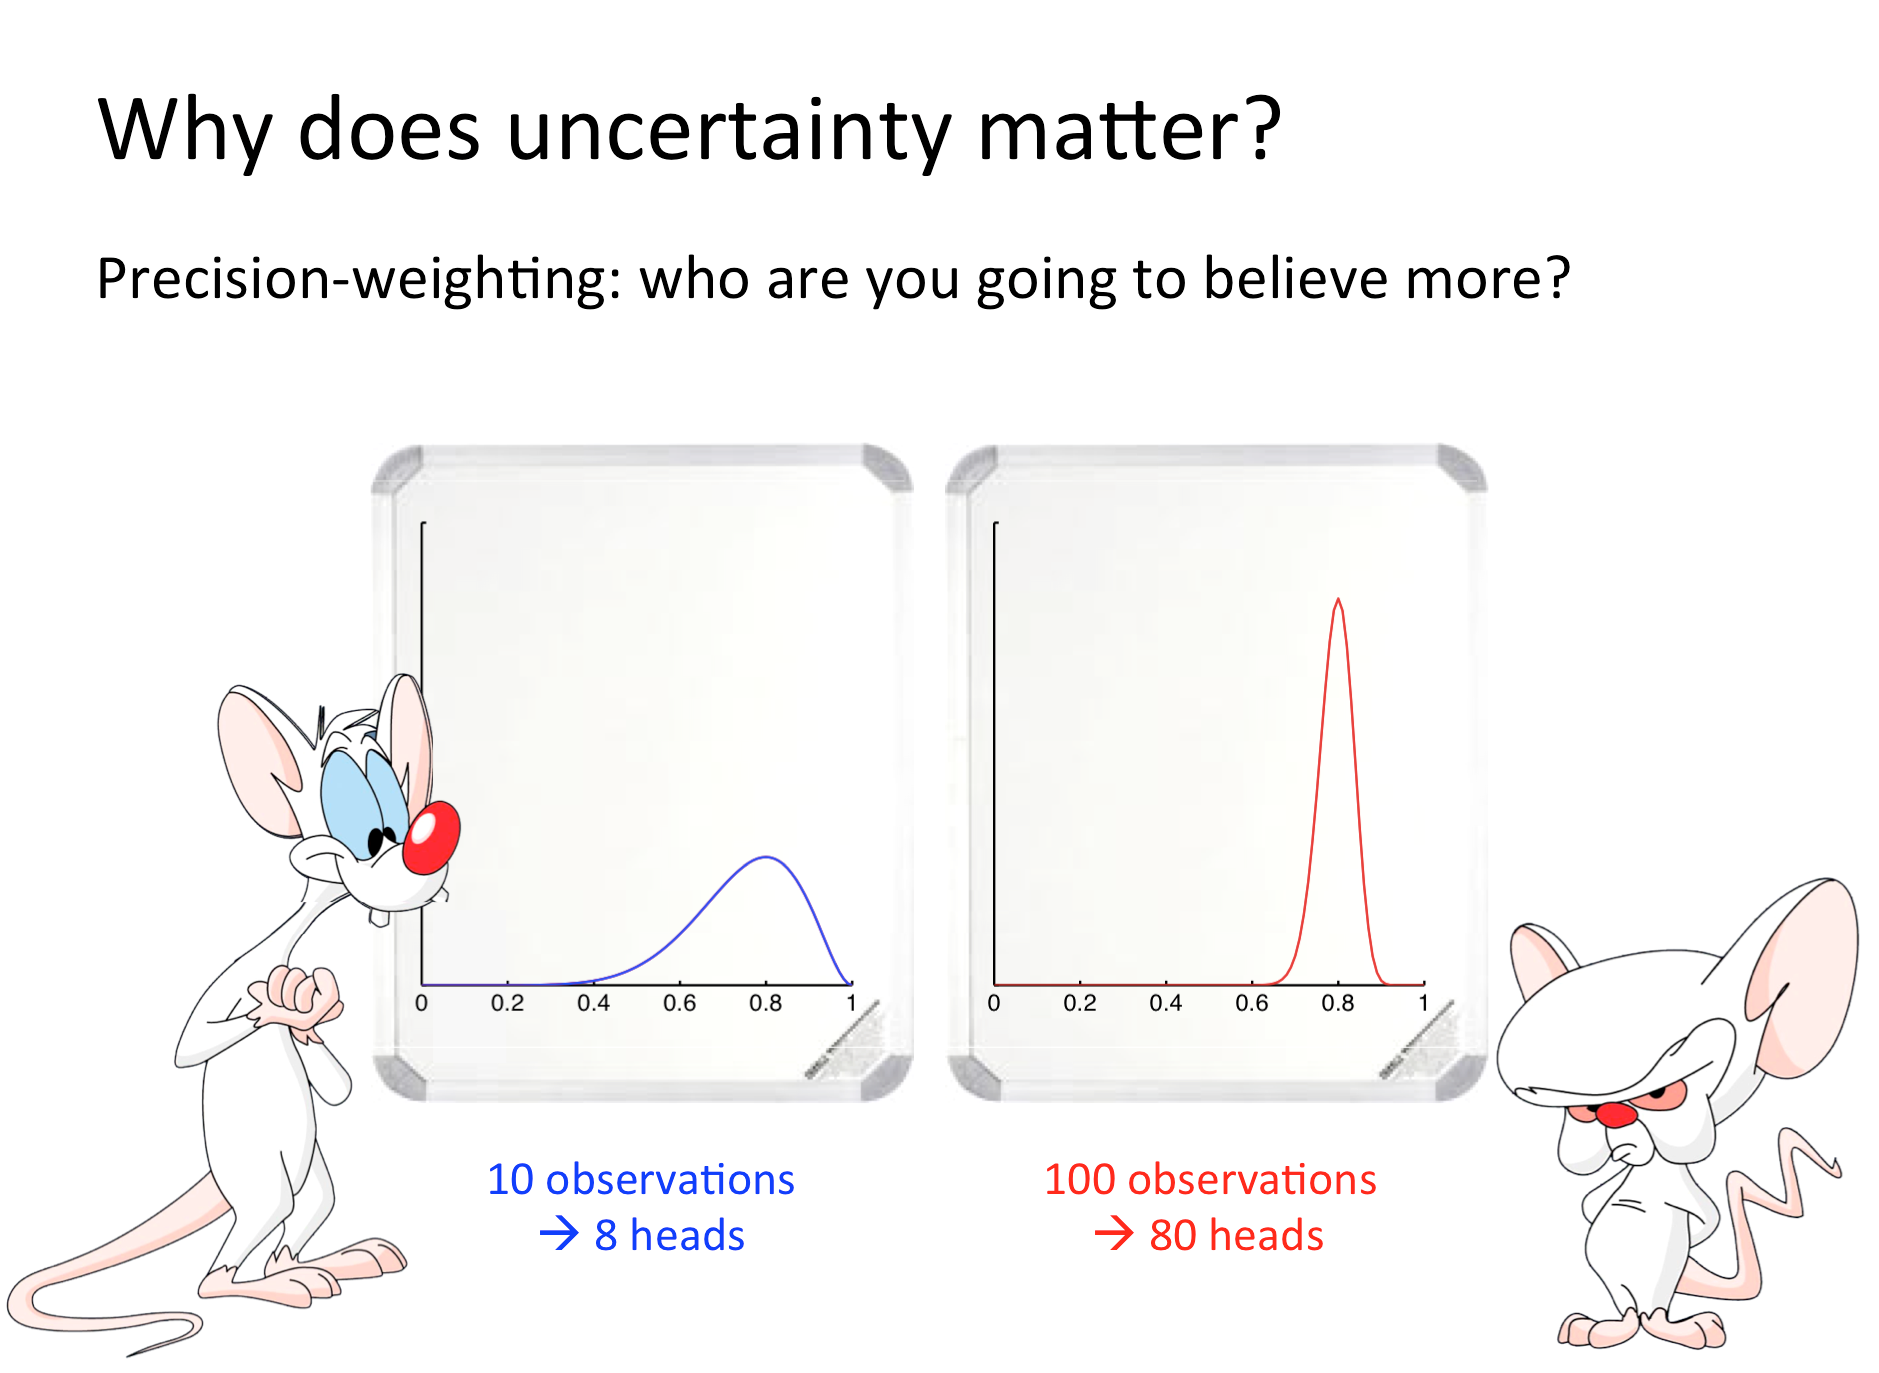
Remember these guys?
By representing our beliefs about q as a probability distribution rather than the single value 0.6,
we are also representing our confidence about those beliefs.
►►►