Lots of participants
To see how the model performs on average, let's run 100 simulated subjects per condition.
Set:
subjects = 1:200;
simulate = true;
fitData = false;
plotIndividual = false;
... save and run.
We don't want to get 200 plots, hence turning off the individual plotting option!
You should get some output that looks like this:
100 subjects in each condition
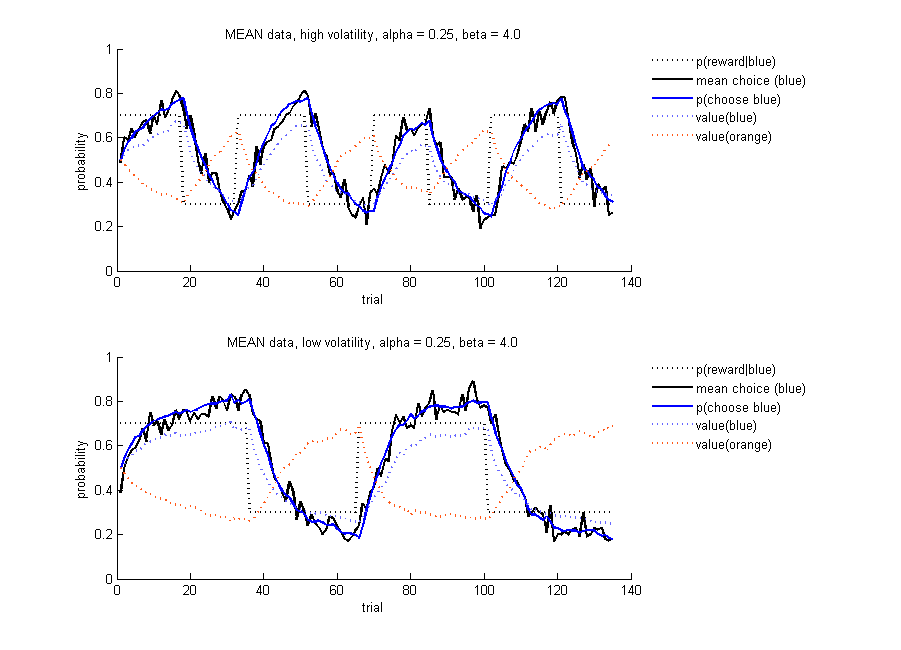
Simulated data for 100 sujects per condition. Top: high volatility, Bottom: low volatility. True probability of getting reward for chosing blue (dashed black); average probability of chosing the blue stimulus (solid blue), based on the value of each stimulus (dashed blue and orange); mean simulated choice (solid black), i.e. for each trial, the mean of a binomial vector of 100 choices, where each entry reflects the choice of that simulated subject on that trial (either 0 or 1). Note that as you increase the number of simulated subjects, the solid black line will start to match the blue line more and more.
Do you think the model is doing better in one of the two conditions? From these plots, you cannot see individual performance. Therefore, let's next look at the proportion of correct responses, defined as picking blue when blue was more likely to be rewarded, and picking orange in the blocks that orange was rewarded more often:
?
Mean probabilty of choosing the better option
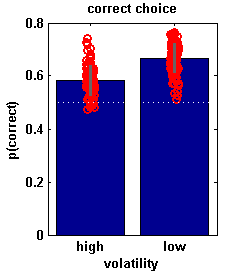
Proportion correct for each simulated 'subject' (red circles); average proportion correct for each condition(blue) ± standard deviation (grey).
The model appears to be performing less well in the high volatility condition. Could you think why that is?
►►►