Fitting the learning rate
In the previous section, we set the hazard rate H used by the model. However it is also possible
to construct a model that infers the reversal rate from the data.
- Run the script "BayesVolatility.m"
The model implemented in this script is like version 2, with the additional complication
that it does not know the value of H but rather infers this from the data.
The model has the following assumptions:
So q can take any value between 0 and 1, and the dependency between trials is such
that qt+1 can have either
- The same distribution as qt+1 - this occurs with probability (1-H)
- A uniform distribution - this occurs with probability H
By the way, is this actually true?
?
No - in fact q is always either 0.7 or 0.3, it doesn't just take any value uniformly.
Take a look at Figure 1.
?
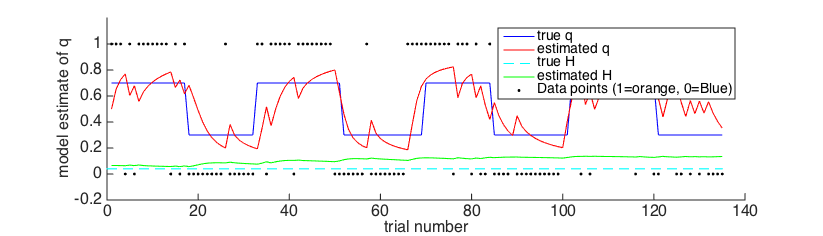
As in the previous learning model, we have the true and estimated values of q.
We also have the true and estimated values of H.
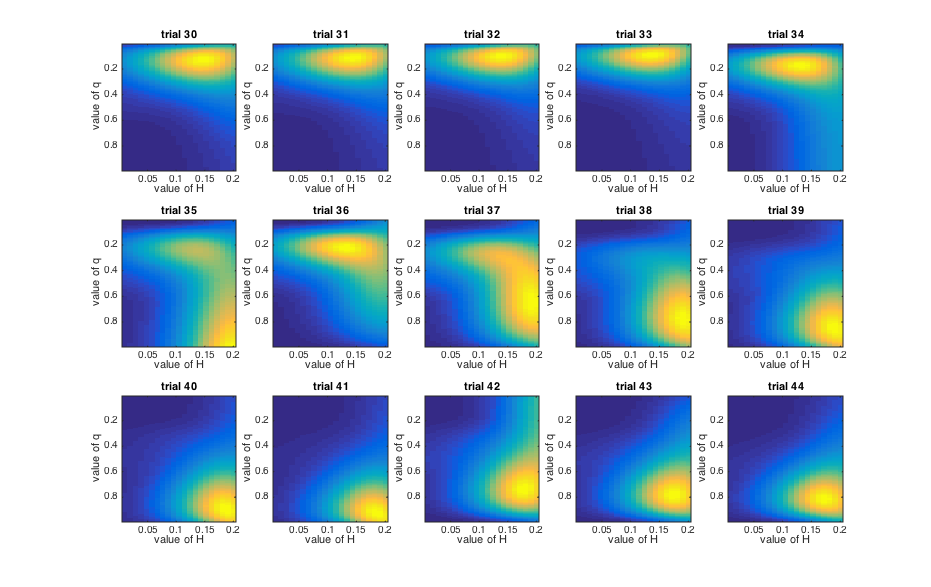
Now take a look at Figure 2. In this figure, we are plotting the posterior over the parameters on each trial -
so in a way this is equivalent to Figure 1 from the previous script.
The difference is, in this case instead of calculating the probability of the data given each candidate value of q,
we have two parameters that both influence the probability of the data, q and H. So:
- We take every possible combination of values of q and H and calculate the probability of the
data given that combination
- This gives us a joint posterior probability for each combination of q and H,
indicated by the colour in Figure 2 (warm colours --> high posterior probability).
In Figure 2, have a look at the estimate of H for the first few trials, before the first reversal.
What do you notice?
?
Initially, the value of H is very low. The model hasn't seen a reversal yet, so it thinks the world is stable.
Find out on which trial the first reversal occurs, by looking at figure 1 and clicking on
the line with the data pointer tool as before.
?
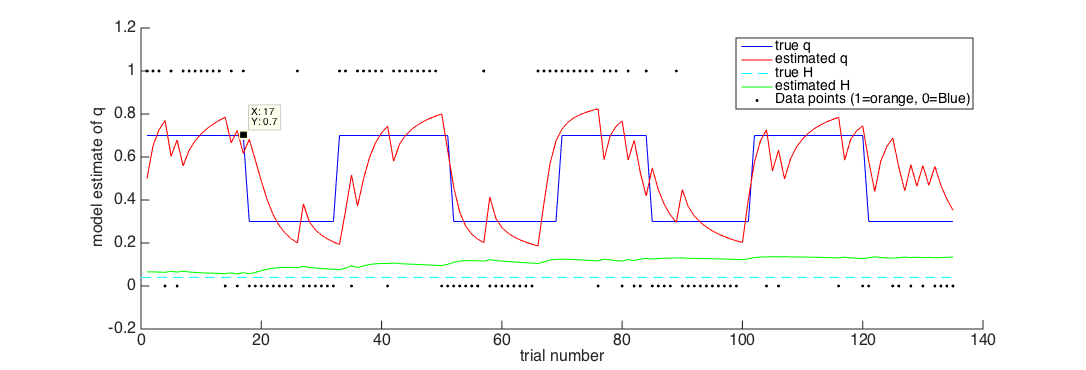
Trial 18
-
Look at figure 2 again. What happens to the estimate of q around this reversal?
Note - trials are pictured left to right in rows, so row 1 is trials 1-5, row 2 is trial 6-10 etc
?
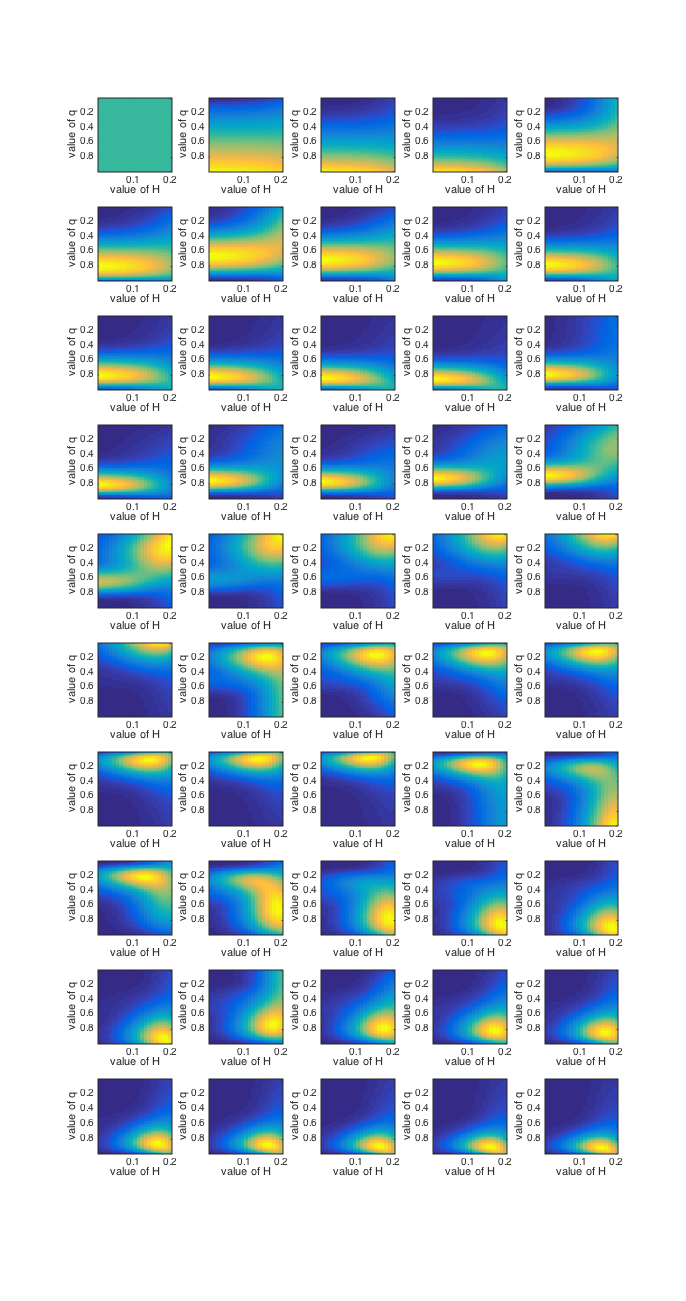
It goes from high (model thinks Orange is mainly rewarded) to low (model thinks Blue is mainly rewarded).
-
What about the estimate of H?
?
It goes up - now it has seen a reversal, the model now realises that the world is not totally stable..
Now let's look more closely at uncertainty in the model
Look at Figure 2. During the third block (trials 33-51) Orange is rewarded 70% of the time.
However, on trials 35 and 42, Blue is rewarded.
?
Here are the relevant trials!
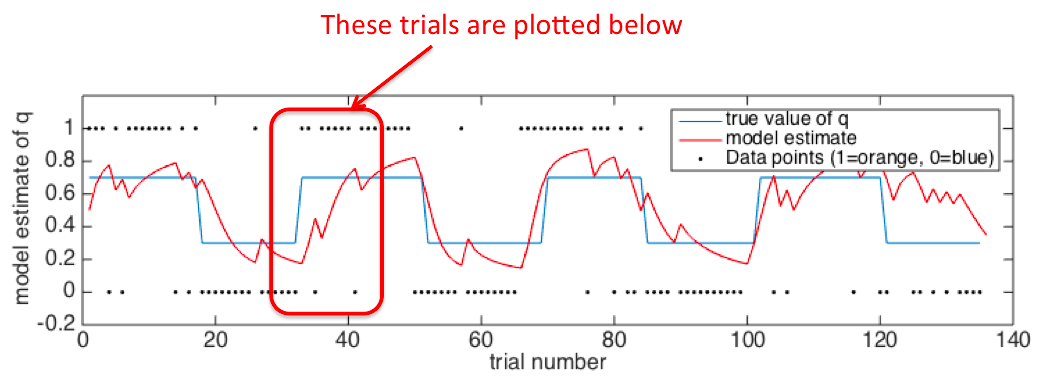
-
On trial 35 (at the start of the Orange block), the model has seen two Oranges in a row and
is starting to think that Orange is the rewarded side. But then on trial 36 Blue is rewarded and it shifts
it preference back to Blue.
-
In contrast, on trial 42, the Orange block is well established, so a single Blue trial has much less
impact on how much the model changes its beliefs.
This illustrates how uncertainty (about whether Orange is now rewarded) influences how much you
should learn from a given data point (a Blue trial).
THE END!
Back to top page ►►►