|
Models of Learning
Developed by
Jill O'Reilly
Hanneke den Ouden
-August 2015
|
Fitting simulated data using a grid search
So - we have a model. What does it mean to 'fit' the model to data?
-
We need to determine the values of the parameters, α and β, that make the model behave
as similarly to the real participant as possible.
As a 'sanity check', we will first fit the model to the simulated data,i.e. estimate the parameter values from the observed choices, to see how well we can 'recover' the parameters we put in.
-
For the simulated data, we know the values of the parameters α and β
-
In the simulated data, α and β are parameters we set ourselves
-
In real subjects' data, α and β are unknown
Grid search
There are various ways you could determine the best-fitting values of α and β.
We are going to use a grid search, which means:
-
We run the model with a whole range of values of α and β
-
For each pair α,β we work out how well the model predicts the data
-
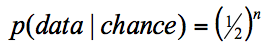
This is defined as the likelihood of the parameters given the observed data
-
We can plot the outcome as a colourful grid!
OPTIONAL: MECHANICS of the GRID SEARCH
Note - this section is conceptually related to the material covered in the first section of the Bayes' tutorial
The aim of the grid search is to find the values of the parameters that maximise the probability of the observed data, given the model that we are fitting.
Let's make that a little bit less abstract. Suppose we have 3 trials.
On every trial, the subjects can pick orange or blue.
That means we have the following potential choice sequences:
[BBB]; [BBO]; [BOB]; [BOO]; [OBB];[OBO]; [OOB];[OOO]
-
For each trial there are 2 options, so there are 23 = 8 possible sequences of three outcomes.
-
This means that for chance behaviour each combination has a probability of occurring of 1/8.
-
This is the probability for a 'chance' model.
What we want of course is that our model that predicts the sequence of choices in our data at above chance level.
Using the update and observation equations, we can predict the probability that the subject chooses Orange (or Blue) given
the Value of Orange and Blue, and the parameters alpha and beta, on each trial.
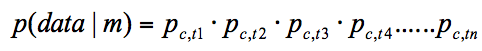
For a sequence of choices, we get a sequence of single-trial probabilities for choosing Orange (or Blue),
which are multiplied together to give a probability for the whole sequence:
This quantity p(data|model) is also known as the likelihood of the data.
Now we need to determine the parameter values that maximise the likelihood of the data.
We will use a very simple approach, called a grid search.
The advantage of a grid search is that it's conceptually easy and easy to implement,
but it's computationally expensive, particularly if you have many parameters.
Luckily for us, we only have 2.
To do a grid search of the parameter space, we define a range of parameter values for each parameter,
and compute for values within this range the probability of the observed responses.
Then we check which set of values explains the data best, and declare that the winner.
So first we need to decide what range of parameter values we want to use.
Can you think of something sensible, based on the playing around with the simulations that you've done above?
?
- α, the learning rate
- lower bound of [0], which means that there is always some learning
- upper bound of [1], which means that the maximum it can learn is the value of the reward itself.
- β, the softmax temperature
- lower bound of [0], so that the bias is always in favour of the option with the higher value
- upper bound of [15], which is fairly liberal and would make for quite deterministic choices (you can simulate this!).
Note about using the grid search approach
The grid search approach is conceptually simple, easy to implement, and results are easy to visualise . However, with models with a larger number of parameters, the computational time and memory quickly explode, even for relatively coarse bins. In addition, you might want to constraint your parameters in other, more complex ways. For example, you might want to constrain your parameters using informative priors (other than the hard bounds we've used here), or even use 'empirical' priors in a hierarchical mixed model approach. Or you might want to use a sampling approach, such as MCMC. Details about these other approaches goes beyond the scope of this tutorial. Rather, we hope that an understanding the basic grid search will provide you with a firm grounding to explore these other options by yourself.
Running a grid search
So we will leave these complexities for now and set up the grid search:
go into the Matlab file RLtutorial_main.m, and set:
subjects = 1;
simulate = true;
fitData = true;
plotIndividual = true;
if simulate
simpars.alpha = .25;
simpars.beta = 4;
end
if fitData
bounds = [0 1; % alpha
0 15]; % beta
nBin = [20 25];
end
... save, and run!
This gives you a plot of the likelihood for all of the bins in a 2D plot.
?
Likelihood landscape for α and β
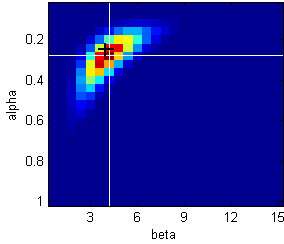
Black cross: true parameter values used to generate the data.
White crosshairs: maximum likelihood (the peak or mode of the distribution)
This plot is a 2-dimensional heatmap that indicates the probability of the data given the model,
with hotter colours meaning higher likelihood
-
Along the x-axis, we are varying β whilst keeping α constant
-
Along the y-axis, we are varying α whilst keeping β constant
-
If we had had 3 parameters in our model, this would become a 3D plot (and much harder to visualise!).
Is there anything that you notice in this plot?
?
-
The likelihood values for different values of α and β do not vary independently. Rather, there seems to be a positive correlation between them. Such a correlation signals that your parameters are to some degree non-identifiable, and that parameter values trade off against each other.
- If this correlation is very strong, then you should take your parameter estimates with a pinch of salt! Luckily for us the correlation is not very strong here.
- Looking for structure in your likelihood 'landscapes' of simulated and refitted data is a good way to check whether you have a nicely behaved model with sufficiently independent/identifiable parameters.
►►►
|