Data analysis
Now that you know the theory of a simple reinforcement learning model, we will start to get our hands dirty using some code. You will learn how to implement the model, and simulate and fit data.
In this section, we will be using the code in the ReinfLearn folder, within the RLtutorial folder that you downloaded.
-
Locate a script called RLtutorial_main.m.
-
Open this script in matlab, you can see that at the top there is a section labelled MODIFY.
-
This is the section of the script where you tell matlab what parts of the code you want to run, and you will be changing this throughout the tutorial.
First, let's have a look at your data!
Set the following parameters:
subjects = x;
simulate = false;
fitData = false;
plotIndividual = true;
... where x is your subject number.
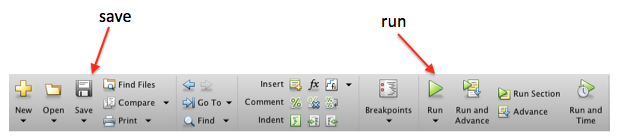
Save the script and press 'run'.
You should see something like this:
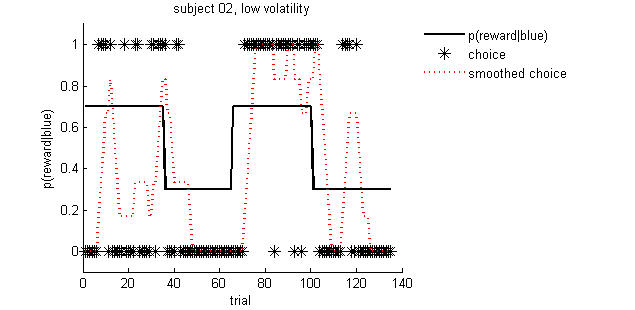
Data from an example subject
-
The solid black line is the 'true' probability of being rewarded for blue. This is specified by the experimenter, and determines the feedback you observed.
-
There were periods where the Blue stimulus was rewarded with a 70% probability
-
There were also periods where the Blue stimulus was rewarded with only 30% probability,
so then it would be better to pick Orange
-
The black asterisks indicate the subject's actual choices, where 1 = blue and 0 = orange.
-
The dashed red line is a 6 trial moving average.
►►►