Run the simulation!
Now you are ready to simulate some data.
In RLtutorial_main, set these parameters
subjects = 1:2;
simulate = true;
fitData = false;
plotIndividual = true;
if simulate
simpars.alpha = .25;
simpars.beta = 4;
end
Save, and press 'run'.
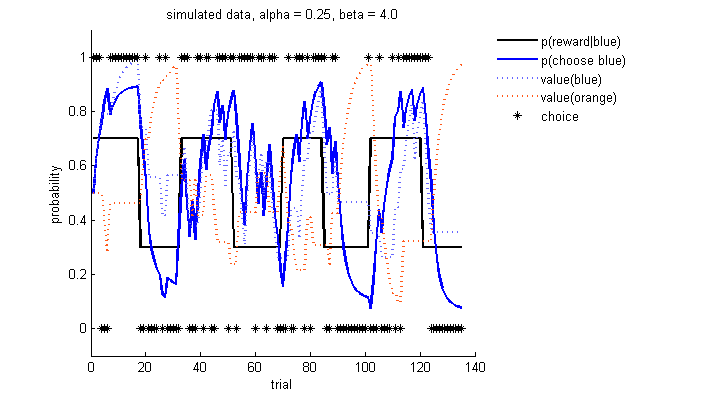
This will simulate data for 2 subjects, using a learning rate of 0.25 and a beta of 4
The true reversal rate in the environment was different for the two subjects.
This is actually determined by the subject number (it was for you, too!)
-
Odd numbered subjects did a high-volatility version of the task with reversals
approximately every 20 trials
True reversal rate is high (volatile)
-
Even numbered subjects did a low-volatility version of the task with reversals
approximately every 25-30 trials
True reversal rate is low (stable)
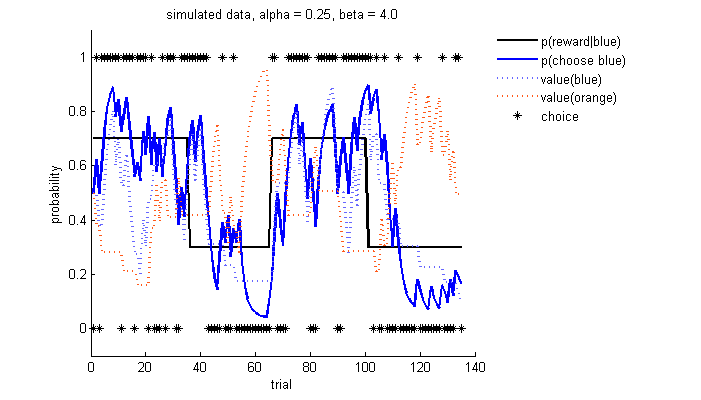
Both figures show:
- The true underlying probabilities (black line) and simulated choices (black asterisks).
-
The values of each of the slot machines (orange and blue dashed lines) that the model learnt based on the feedback it received for each choice.
-
The choice probability based on these values (using the softmax function).
You can see that some of the time, the choice doesn't follow the maximum choice probability
because of some randomness in the choices due to the softmax function
(where some of the time you pick the suboptimal option.
To get rid of some of this noise, we can also have a look at what the simulated data looks
like when we average over a large number of subjects,
and how well the model performs in this task when we change the learning rates and softmax.
►►►