|
Models of Learning
Developed by
Jill O'Reilly
Hanneke den Ouden
-August 2015
|
Bayesian Updating
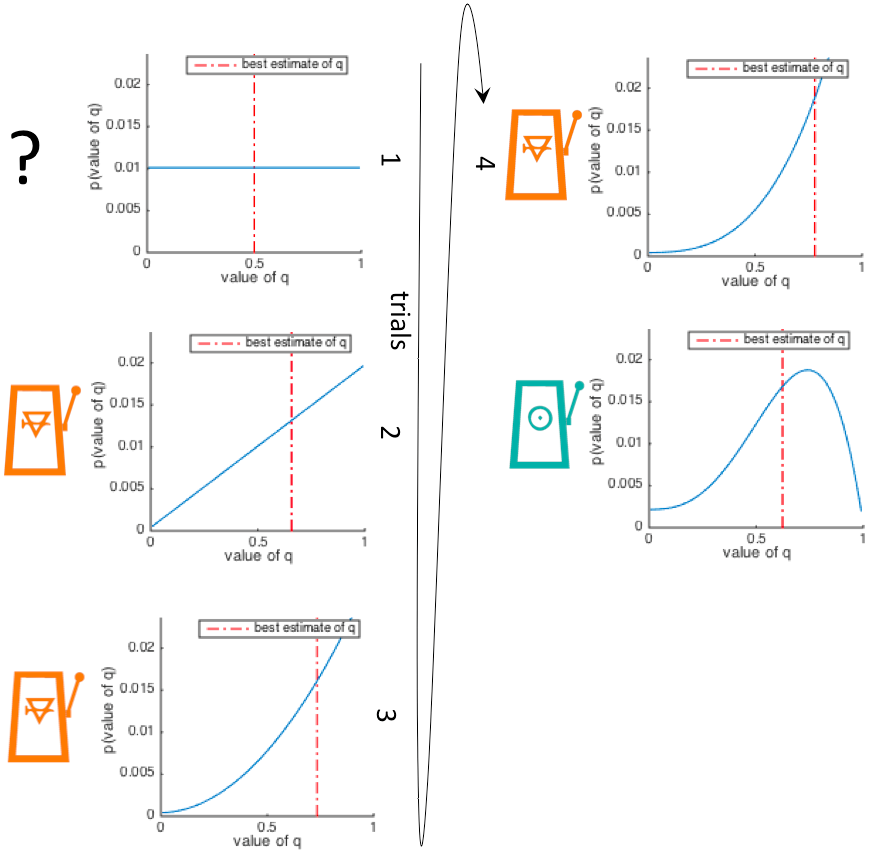
Take a look at Figure 1 in the output from the model you just ran.
In this figure we have plotted the prior probability distribution
for q on each of trials 1-5. - Hopefully this will be familiar from the coin-tossing example.
?
The slot machine pictured to the left of the prior for each trial is the outcome from the previous trial,
which is why this is ''?'' on trial 1
- Why are we plotting the prior on each trial here, as opposed to the posterior as we did in Part 1?
?
HINT: think about what we are trying to predict
?
- The prior on trial t tells me what the observer believes at the start of trial t
- The posterior on trial t tells me what the observer believes after the outcome of trial t
When the observer makes his choice on trial t, this is based on what he knows at the start of trial t.
For example, on trial 1, the observer has no preference for the blue or orange option.
On trial 2, his preference is based on a single observation, so the prior is a straight line (like the
likelihood functions we saw in Part 1 of this tutorial). etc.
- What do you think the dotted red line indicates?
?
-
This is the mean value of the distribution.
-
If you asked the model to give it's best single estimate for the value of q,
that red line would be it!
-
For example at the beginning of trial 3, the model has seen one trial in
which orange was rewarded, and one trial in which orange was not rewarded.
So it's best guess of the probability that orange gets rewarded, ie q, is
0.5.
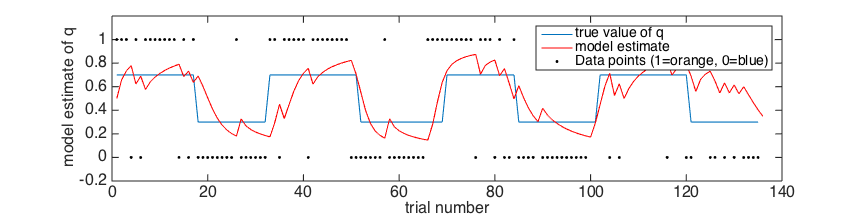
Now take a look at Figure 2.
?
In this figure we have plotted the model's estimate of (q) across trials (red trace) and also the true
probability that orange is rewarded.
If you want to see the whole probability distribution over q, have a look at Figure 3.
-
The shading in the background represents the probability distribution on each trial -
like the distributions in Figure 1
-
The dashed line is the best estimate of q, and the solid white line is the true value of q
as in Figure 2.
►►►
|